Heat Record: Global Temperature, 1948–2026
지금 보고 있는 영상

Heat Record: Global Temperature, 1948–2026
조회수 1,575
영상 설명 · 눌러서 펼치기
Earth's surface temperature, mapped every month from 1948 all the way to right now — then continued day by day through the record heat of July 2026.
White marks 14°C, Earth's long-term average — red is hotter, blue is colder. That's why the map visibly pulses with the seasons: it's the actual temperature, not a deviation from average.
━━━━━━━━━━━━━━━━━━━━━━━━━━━━
🎵 Music
"Fearless First" Kevin MacLeod (incompetech.com)
Licensed under Creative Commons: By Attribution 4.0 License
http://creativecommons.org/licenses/by/4.0/
━━━━━━━━━━━━━━━━━━━━━━━━━━━━
📁 Data
Map (1948–2026): NCEP/NCAR Reanalysis 1 (https://psl.noaa.gov), bridged with Open-Meteo/ERA5 (https://open-meteo.com) from March 2026 onward
Global mean temperature: NASA GISTEMP (https://data.giss.nasa.gov/gistemp/)
CO₂: NOAA GML (https://gml.noaa.gov/ccgg/trends/co2/)
July 2026 daily global average: Climate Reanalyzer, University of Maine (https://climatereanalyzer.org/clim/t2_daily/)
━━━━━━━━━━━━━━━━━━━━━━━━━━━━
🔔 Subscribe for more data-driven visual stories.
🐦 X (Twitter) → https://x.com/rankings_the
White marks 14°C, Earth's long-term average — red is hotter, blue is colder. That's why the map visibly pulses with the seasons: it's the actual temperature, not a deviation from average.
━━━━━━━━━━━━━━━━━━━━━━━━━━━━
🎵 Music
"Fearless First" Kevin MacLeod (incompetech.com)
Licensed under Creative Commons: By Attribution 4.0 License
http://creativecommons.org/licenses/by/4.0/
━━━━━━━━━━━━━━━━━━━━━━━━━━━━
📁 Data
Map (1948–2026): NCEP/NCAR Reanalysis 1 (https://psl.noaa.gov), bridged with Open-Meteo/ERA5 (https://open-meteo.com) from March 2026 onward
Global mean temperature: NASA GISTEMP (https://data.giss.nasa.gov/gistemp/)
CO₂: NOAA GML (https://gml.noaa.gov/ccgg/trends/co2/)
July 2026 daily global average: Climate Reanalyzer, University of Maine (https://climatereanalyzer.org/clim/t2_daily/)
━━━━━━━━━━━━━━━━━━━━━━━━━━━━
🔔 Subscribe for more data-driven visual stories.
🐦 X (Twitter) → https://x.com/rankings_the
TheRankings 다른 영상
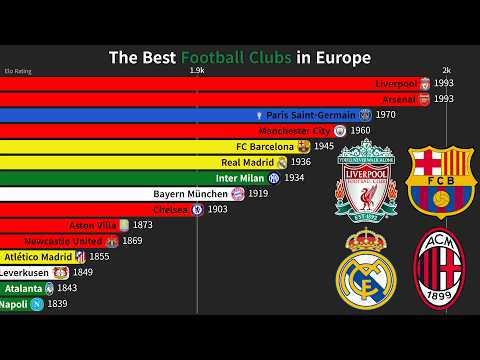
The Best Football Clubs in Europe | Top 15 Clubs by Elo Rating (1970-2026)
조회수 4,929

National Football Team Elo Ranking: 1956-2026
조회수 3,870

Ronaldo vs Messi — Career Stats at the Same Age
조회수 1,630

Top 15 Most Subscribed Youtube Channels (2019-2024)
조회수 15,773

Top 15 Most Viewed Youtube Videos over time (2011-2022)
조회수 753,127

(2021 update) Most Subscribed Youtube Channels (2012-2021)
조회수 97,968

Annual GDP Growth Rate for OECD countries (1980-2020)
조회수 40,728

Top 15 Richest People in the World over time (2000-2021)
조회수 64,801